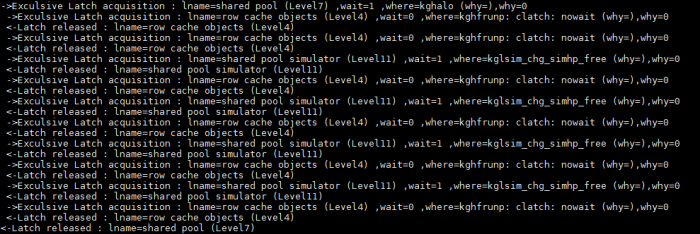
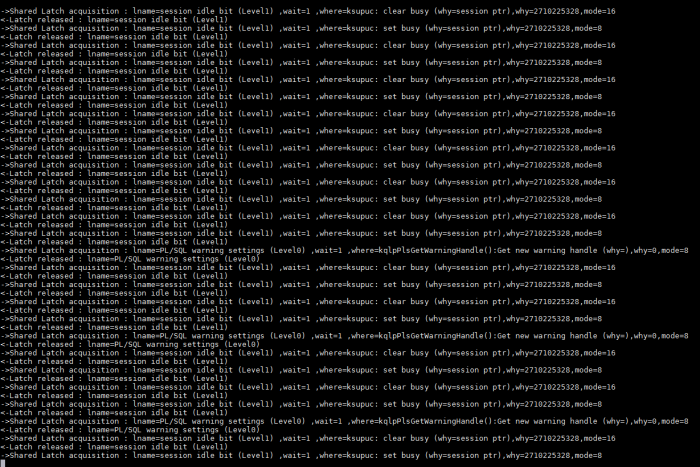
In an oracle database, it’s very common for a process to hold multiple latch at different level in different mode (shared/exclusive) concurrently. The question is : Is it possible to draw a call graph to track the different step of acquisition and release for a particular process ?
Linux dynamic tracing tools like perf,systemtap and bcc/bpf can be a valuable asset not only in troubleshooting performance problem but also in helping us getting a deeper understanding of application internal.So let’s use them !
Test system : (ORACLE 11.2.0.4 / OEL6 UEK4)
The dedicated functions used for latch acquisition and release which depend on the database version and OS was covered in many blogs. Frits Hoogland and Andrey Nikolaev have many great articles in this area :
- https://fritshoogland.wordpress.com/2015/07/17/oracle-12-and-latches/
- https://fritshoogland.wordpress.com/2015/07/17/oracle-12-and-latches-part-2/
- https://fritshoogland.wordpress.com/2015/12/27/oracle-12-and-latches-part-3/
- https://andreynikolaev.files.wordpress.com/2016/03/latches_and_mutexes_in_oracle_12c.pdf
- https://andreynikolaev.wordpress.com/2010/04/12/latch-internals-information-sources/
- https://andreynikolaev.wordpress.com/2010/11/17/shared-latch-behaves-like-enqueue/
Based on the previous articles and some testing i was able to develop a systemtap script that will display a graph of latch acquisition/release with different context variable.
List of function probed :
- ksl_get_shared_latch(laddr,wait,where,why,mode)
- kslgetl(laddr,wait,where,why)
- kslfre(laddr)
Installation :
- Download latch_callgraph.stp
- Run latchname.sql and place the output file latchname.sed in the same directory as latch_callgraph.stp
- Run where_why_decode.sql and place the output file where_why_decode.sed in the same directory as latch_callgraph.stp
Time for demo :
create table test_latch as select * from dual;

alter system flush buffer_cache;
Launch the systemtap script :
stap -v latch_monitor.stp -x 9154 | sed -f latchname.sed |sed -f where_why_decode.sed
Run this script in the session to monitor :
select * from test_latch;
Extract from Script output :

We can clearly see that all lower level latch can not be requested in willing-to-wait mode if we are already holding a higher level latch.This due to deadlock prevention
requirement (More info in Oracle Core /Jonathan Lewis and oracle8i internal services for waits latches locks /Steve Adams) .Ex :while holding “shared pool” latch level 7 “row cache objects” latch level 4 is requested in immediate mode.
If we re-execute our test query a second time there is no sign of “cache buffers chains” latch acquisition or release in the script output.This mean we are really missing something !
Further investigation is needed ! Let’s check which “cache buffers chains” latchs are protecting the table blocks in the buffer cache.
select * from dba_objects where object_name ='TEST_LATCH';
select distinct hladdr  from x$bh b  where b.obj =  87350;
After getting the “cache buffers chains” latch address ,let’s put a probe point into one of them to track in which function the latch is manipulated.For that i will use perf tool to track modification of the latch memory address.
perf record -e mem:0x000000009F668880:w -p 9154
It’s clear that some important action are happening inside function “kcbgtcr”,”kcbrls”,”kcbzar” without dedicated function calls to ksl_get_shared_latch/kslfree. Alexander Anokhin already covered this here :
” Obviously some important actions happen inside functions without dedicated function calls. Thus these actions are invisible.
As an example, which I would like to emphasize is the functions related with latches.
There are dedicated functions related with latches in KSL (Kernel Service layer Latching & Wait) layer as kslgetl (KSL Get Exclusive Latch), kslgetsl (KSL Get Shared Latch), etc.
But also latches can be captured inside functions like kcbgtcr (consistent get) or kcbgcur (current get) without dedicated calls of ksl* functions.
Looks like duplicated code. In fact historically there are macroses KSLBEGIN / KSLEND in many functions, so code is not duplicated but as a result we do not see actions with latches as dedicated calls.”
But which function is acquiring the latch and which one is releasing it.We must dig deeper !
For that i will use gdb :
gdb -p 12502

watch *0x000000009F668880
command
x/4xw 0x000000009F668880
c
end
And here is the output :

Thanks to Andrey Nikolaev we can decode the content of the memory address.
Example from Andrey Nikolaev :
“oradebug peek 0x6000AEA8 24
[6000AEA8, 6000AEC0) = 00000002 00000000 00000001 00000007
ˆNproc ˆX flag gets latch#
”
The latch# “0x000000b1” correspond to a “cache buffers chains” latch.Here is the flow of execution :
- kcbgtcr acquired the latch
- kcbgtcr released the latch and incremented the gets count
- kcbrls acquired the latch
- kcbzar released the latch and incremented the gets count
It seems that other methods must be investigated for drawing a complete call graph of latching activity for a specific process.This is primary caused by the manipulation of latch inside other functions without the use of dedicated calls like “kslfree”.
That’s it 😀


