Few days ago i was notified of a very slow database startup time after someone installed a new application. Here is the result obtained in a clone environment :
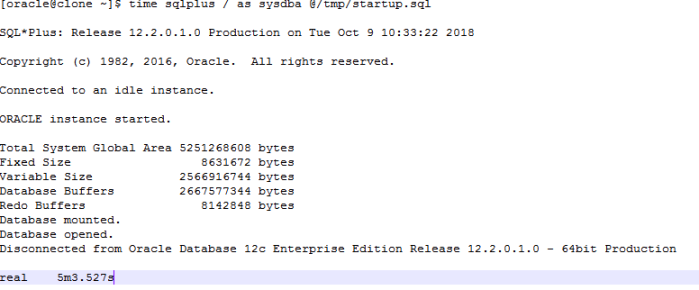
5 Min ! That’s great … let’s see what’s going on :
Few days ago i was notified of a very slow database startup time after someone installed a new application. Here is the result obtained in a clone environment :
5 Min ! That’s great … let’s see what’s going on :
Few weeks ago Tanel Poder published a great video talking about Oracle’s write consistency , DML restarts and demonstrating also how we can detect them.He also published a script that allow finding UPDATE/DELETE statements that hit the write consistency issue & have to restart under the hood. But as he stated it uses V$SQL_PLAN_MONITOR, so requires Diag+Tuning pack licenses.
The purpose of this blog post is to show another way to detect statements hitting the write consistency issue.
In my last blog post i described a geeky way to trace back the responsible PL/SQL code for a particular memory request into the PGA. It was based essentially on a dynamic tracing tool “systemtap” to probe on specific functions entry such as KGHAL memory allocator functions (Based on Stefan Koehler dtrace script ) and relied on calling an internal oracle function “pfrln0lookup” using “oradebug call” to get the actual PL/SQL line number.It would have been safer if we reverse engineered the function “pfrln0lookup” to extract only the thing that matter and avoid calling it but this need time and is forbidden :p !
So here i will describe a safer and simpler approach relying only on collecting multiple errorstack dump samples and a little shell script to parse the trace file !
Memory bound applications are sensitive to memory latency and bandwidth that’s why it’s important to measure and monitor them.Even if this two concepts are often described independently they are inherently interrelated.
According to Bruce Jacob in ” The memory system: you can’t avoid it, you can’t ignore it, you can’t fake it” the bandwidth vs latency response curve for a system has three regions.
Suppose we have a CPU bound application/query/program. How to know what my CPU is really doing ? What’s my CPU bottleneck ? How much my CPU are stalled ? For what resource ? How to characterizes my Workloads ?
Answering this question can helps direct performance tuning !
Let’s take a sample program to analyze :
This is my second post under the theme of how to extend our capabilities to trace and profile PL/SQL code.This time motivated by a comment from Luca Canali on my previous post :
So based on my previous work on geeky PL/SQL tracer let’s see how we can obtain a geeky PL/SQL on-CPU Flame Graph !
This blog post is about how to extend our capabilities to trace and profile PL/SQL code.It’s primarily motivated by few tweets from Franck Pachot and of course because it’s FUN !
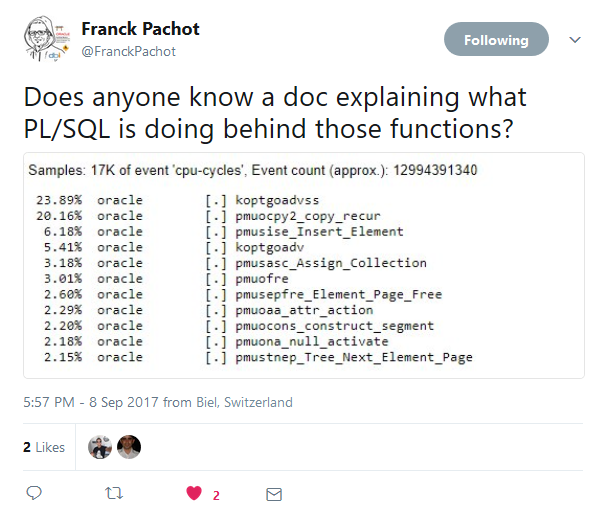
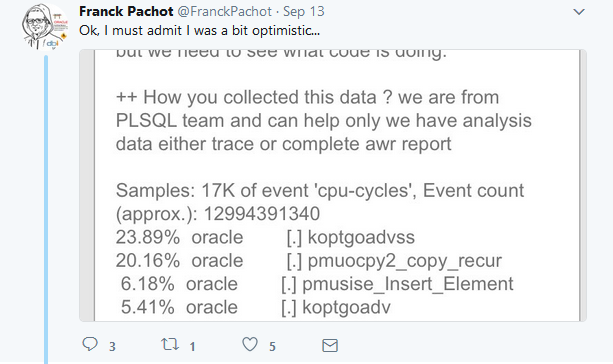
So in the first part of this series we are going to answer to this questions : Can we map those underling function to the source PL/SQL object and line number ? Can we obtain a full trace ? Of course yes otherwise there will be no blog post :p
Updated 12/05/2017
It will be great to have a tool that will extract latch holder information directly from state objects stored inside the SGA. This way we will reduce the overhead when troubleshooting latch contention an beside that it’s also cool !!
This may sound difficult ! How to proceed ? and the answer is …. Memory reference tracing !
Since oracle 12.2.0.1 Adaptive Dynamic Sampling result are stored inside SPD as a special directive type “DYNAMIC_SAMPLING_RESULT”. This will allow the result of ADS to be persisted on disk,thus it will survive memory flush and database restart.For more detailed info please check Mauro Pagano blog Post Something new about SQL Plan Directives and 12.2
We may ask at this moment is there some sanity check that will trigger the refresh of this ADS result stored as sql plan directive when the table data is marked stale (STALE_PERCENT) ?
In an oracle database, it’s very common for a process to hold multiple latch at different level in different mode (shared/exclusive) concurrently. The question is : Is it possible to draw a call graph to track the different step of acquisition and release for a particular process ?
